A Maturing Model of Quality
“Measurement is the first step that leads to control and eventually to improvement...If you can’t measure something...you can’t improve it.” — H. James Harrington
How do we assess the effectiveness of our quality system?
An appropriate response may be captured within the above quote by H. James Harrington, a American author, lecturer, consultant, international performance improvement and quality guru, entrepreneur, engineer and businessman. Throughout his long career, he developed many concepts. Some of the more important ones are poor-quality cost, total improvement management and business process improvement. He has authored 35 books and created ten software packages on performance improvement. Harrington’s career in quality and performance improvement spans more than 65 years. During this time span, the quality system has evolved tremendously from then to now.
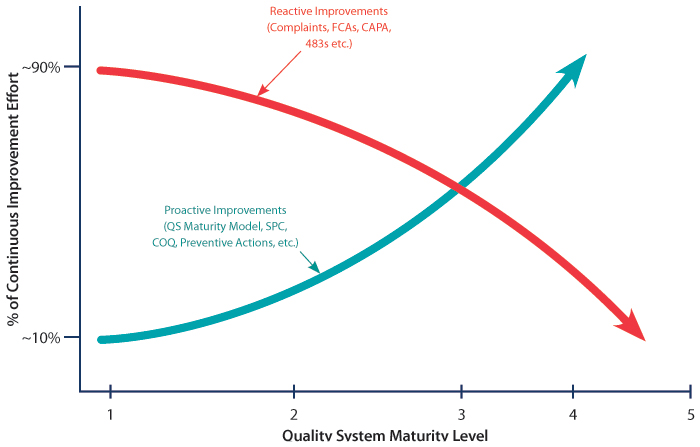
Traditionally, at the end of management review, a signature was requested from Management with Executive Responsibility (MWER) and those involved in Quality Management Review (QMR), attesting to the suitability and effectiveness of the quality system. Traditional management reviews typically consisted of a collection of data tables, charts and graphs trying to explain the quality system’s performance since the last management review. These charts and graphs, (which usually portrayed things like how many complaints were received, how many nonconformances were generated, how timely were CAPAs being executed, what were the outcomes of significant audits, etc.,) tried to paint a picture of the health of the quality system. The challenge with this scenario is that it was difficult to make a subjective leap from a collection of data, to the statement that the quality system is suitable and effective (see red line in Figure 1).

Figure 1 Maturity Model (SPC=Statistical Process Control, COQ=Cost of Quality, CAPA=Corrective and Preventive Action, FCA= Field Corrective Action)
Today, quality systems are transitioning from a heavy focus on data and looking at past performance through charts and graphs, to a systematic review of each quality system element, using Maturity Model methodology. With this methodology, each quality system element has criteria starting at Level 1 (just getting started) to Level 5 (world class). Systematic assessments are performed at each manufacturing facility to determine relative maturity level for each element, as well as the gaps to achieving the next maturity level. The manufacturing sites then prepare quality plans to close those gaps. At the corporate level, a review of maturity levels for all quality system elements across all sites enables objective assessment toward progress in growing a quality system’s maturity. In addition, this approach allows the identification of areas of weakness and proactive work toward improvement (see blue line in Figure 1).
To learn more about the continuous expansion of quality system maturity level modeling, register to attend the 2017 PDA/FDA Joint Regulatory Conference, Sept. 11–13, 2017, at the Renaissance Hotel in Washington, D.C. In “Session B1: Quality Systems: Maturity Models and Continuous Improvement,” representatives from industry and the U.S. FDA will team up to describe maturity model methodology within a broader quality system and provide examples of inspection findings from various quality systems.
Learn more about the 2017 PDA/FDA Joint Regulatory Conference and related PDA Education courses.


