Company Sees Success With Automated Endotoxin Testing
Pharmaceutical manufacturers are embracing automation and robotics, mainstays of other manufacturing fields, but can automation and robotics be brought into the QC lab as well?
Pfizer’s biotechnology site in Andover, Mass., has used Charles River Laboratories’ Endosafe® Multi-Cartridge System (MCS™) for testing routine water samples in the QC microbiology lab since 2010. Although this system reduces the individual sample testing time from 60 to 15–20 minutes, each unit can only process five samples at a time. In order to process all samples received on a given day, analysts were often required to rely on three MCS™ systems and remain at the bench for up to six hours. This led the site to perform a beta evaluation of Charles River Laboratories’ Nexus™ testing system in 2013.
The NexusTM system relies on robotics and automation to conduct LAL testing. First, an analyst loads a robotic deck of cartridges and then sets up the robotic software. Next, the analyst starts the robotic automation cycle. During this cycle, the system performs dilutions, tests samples, discards cartridges and reports the results. This process removes the analyst from much of the testing compared to traditional methods where the analyst prepares sample dilutions and standard curves, plates all samples, adds lysate to the plate and then sets the plate on a plate reader. During the original evaluation, a Pfizer analyst attempted to process six independent test sessions. Although the instrument was not successful in completing full assay runs, the data obtained was evaluated in regard to spike recovery, spike coefficient variation (CV) and sample CV. Due to these results, the site agreed to perform a second evaluation of the Nexus™ testing system once the issues uncovered during initial testing were addressed.
After updating the system, Charles River Laboratories delivered and installed a commercially available Nexus™ testing system at the Andover facility. In order to determine if the system issues identified during the original evaluation had been fixed, the site management designed a second evaluation. Whereas the initial evaluation consisted of 180 samples, the second evaluation included a minimum of 600 samples. In addition to evaluating if the original issues had been resolved, spike recoveries and spike CVs generated by the Nexus™ testing system were compared against spike recoveries and spike CVs by an analyst using the stand-alone MCS™ systems. In order to avoid having the results skewed by sample matrix issues, all testing was performed with water samples.
While the Andover site chose to evaluate the Nexus™ system, the company recognizes that there are other automated endotoxin solutions on the market and what works best for another lab may be a different product. Still, the author believes that the implementation and evaluation of Nexus™ at the Andover site offers lessons learned for other labs considering an automated endotoxin solution.
System Trial Shows Promise
The spike recoveries obtained from the secondary evaluation were compared to 600 spike recoveries that had been obtained using the stand-alone MCS™ readers during the same timeframe. Although the standalone MCS™ readers had a mean spike recovery closer to 100% (103% vs 95%), the standard deviation for the Nexus™ testing system was smaller (14 versus 22). The data was then analyzed using a twosample t-test to determine if the difference in results was statistically significant. A p value of 0.00 was obtained, indicating that the results obtained were statistically significant (Figure 1).
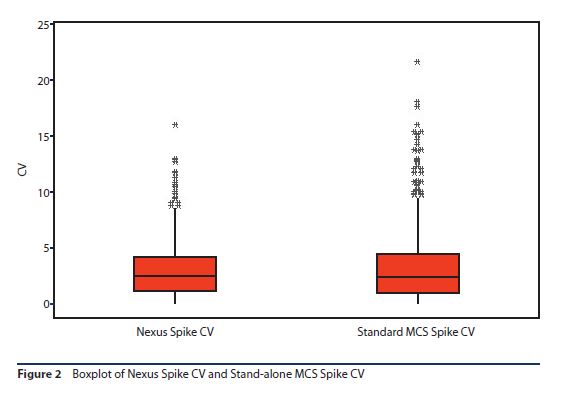
As with the spike recovery evaluation, the spike recovery CVs obtained from the Nexus™ testing system were compared to CVs from the 600 spike recoveries that had been obtained using the stand-alone MCS™ readers. The CVs were similar (3.1% compared to 3.4%) with a standard deviation of 2.5% for the Nexus™ testing system and 3.3% for the stand-alone MCS™ readers.

This data was also then analyzed using a two-sample t-test to determine if the difference in results was statistically significant. A p value of 0.116 was obtained, indicating that there was no statistically significant difference in the results obtained (Figure 2).

In addition to focusing on spike recoveries and spike recovery CVs, the secondary evaluation allowed the Andover site to look at efficiencies that could be gained by implementing the Nexus™ testing system into the routine testing lab. Analyst touch time decreased from >3 hours to around one hour per testing session for 50 to 60 samples. The Nexus™ testing system’s bar code scanner decreased documentation errors on the front end of the assay by removing the need for the analyst to manually type each sample into the laboratory information management system (LIMS). Another benefit was that the results generated by the Nexus™ testing system were directly transferred into the LIMS, saving on additional opportunities for documentation errors and reducing assay review time. Finally, the rate of invalid assays obtained was compared for the Nexus™ testing system and the stand-alone MCS™ readers. Although the data set for the Nexus™ testing system was very small, there was a large difference, with the Nexus™ testing system having an invalid assay rate of 1% compared to 5% for the stand-alone MCS™ readers (four years of testing or ~75,000 samples evaluated for the invalid rate for the standalone MCS™ readers). Invalid assays are those assays where the spike CV or sample CV is >25% or the spike recovery is not between 50 and 200%.
Following this successful evaluation, Pfizer ultimately chose to purchase the Nexus™ testing system in 2014. The instrument is now validated and used for routine water endotoxin testing. This process suggests that endotoxin testing can be automated using robotics in the QC lab, just as product can be manufactured using automated isolators on the floor.


