Seeing the Hidden How Contamination Recovery Rates Offered a Better Look at the True State of Microbial Control

Using contamination recovery rates to evaluate an environmental monitoring trending program changed the way Paula Peacos, Associate Director, Global Microbiological Compliance, Bristol- Myers Squibb, viewed the movement of microbial contamination within a facility, according to her presentation, “Using Contamination Rates for Environmental Monitoring Trending,” Oct. 16, at the 12th Annual PDA Global Conference on Pharmaceutical Microbiology.
Her experience in using contamination recovery rates in this manner resulted from an actual environmental monitoring program she implemented about eight years ago for a previous employer. Peacos believes it still offers valuable insights into how facilities can look more holistically at environmental monitoring. She presented a fabricated model to demonstrate how such a program operates and its benefits.
Limits to Traditional EM
There were many reasons for adding contamination recovery rates to the existing trending program. The facility was a low bioburden facility which used an almost entirely manual process to manufacture a biologic product with a 72-hour turnaround. Therefore, the process was highly dependent on exceptional process control (i.e., the facility had to be clean at all times and operators had to maintain constant vigilance). The existing environmental monitoring trending program was largely based on the excursion rates.
Although this program was robust, it did have limitations. Since any actions taken were generally based on excursions (including actions involving adverse trends), the program was reactive as opposed to proactive. An excursion would usually not be detected until two to three days after sample collection. More importantly, however, trending by excursion rate focused only on individual plate counts. It did not account for any of the microbial recoveries obtained on the other samples collected at the same sampling interval.
Peacos envisioned a program that would detect and mitigate issues before limits were exceeded, proactively identify adverse trends and offer more effective data analysis. She looked to USP <1116> Microbiological Control and Monitoring of Aseptic Processing Environments, which recommends using contamination recovery rates in place of traditional alert and action levels in aseptic areas (1). In aseptic areas, there are inherently low bioburden levels present and the available environmental monitoring methods are limited in terms of their ability to recover microorganisms. She applied this rationale to other areas of the facility, including ISO 5, ISO 7, ISO 8 and Controlled Not Classified (CNC) areas.
To determine the contamination recovery rates, Peacos used the following equation:
Contamination rate = (total number of samples greater than 0 cfu/total number of samples collected) * 100
This equation takes into account the total number of recoveries across all samples collected for a given area and better reflects the actual state of the environment with the end result that “you know how much microbial contamination you have and where it is,” she explained.
The study compared excursion rates versus contamination rates within four different types of locations (ISO 5, ISO 7, ISO 8 rooms and CNCs). For each location, excursion and contamination rates were compared for active air viables and surface viables.
CRR Show Surprising Trends
The impact of adding the contamination recovery rates to the existing trending program surprised Peacos. For example, she had expected the floor to be the prime location for contaminants, but the contamination recovery rates showed that the prime location was actually the air.
“I used to worry about operators picking organisms up from the floor and tracking them in,” she said. “I still worried about that, but I paid more attention now to things like rapid movements in the clean areas, operators holding doors open too long and changes in differential pressure, because the contamination rates in the air were actually higher.”
By reviewing all of the samples holistically using the contamination recovery rate, she could better see drift in the overall state of control. Areas of greater risk became visible, as did effects of unplanned events. She was also able to more effectively track the performance of individual operators.
Peacos found that the contamination recovery rate was a better indicator of an operator’s aseptic technique than of the excursion rate. The data showed that while some operators had excursion rates of 0%, these same operators had contamination recovery rates much higher than other operators. This meant that these particular operators were more likely to introduce microbial contamination into the process because it was present more often on their gowning materials. Yet none of this data was apparent when looking at the number of exceeded alert and action limits alone.
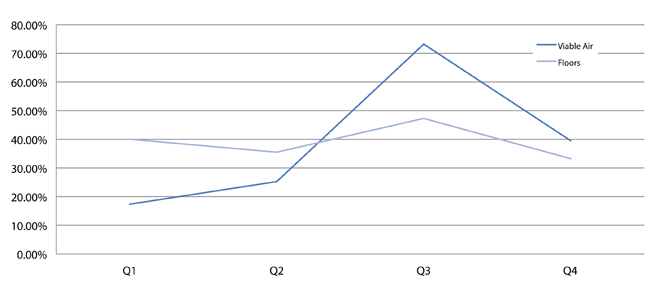
Interestingly, seasonal variations became visible. An example is presented in Figure 1. Peacos pointed out that the facility was located in northeastern United States. January through March are generally the coldest and driest months of the year, which corresponds to the lowest contamination rates shown in Figure 1. Temperatures generally remain cool through early June. Beginning in late June, however, temperatures rise significantly.
“Our hottest months are usually July to September,” she said. “The operators are sweating and there is a lot more shedding. Then in October through December, it starts to cool off, and you see this [the contamination rates] drop again.”

Figure 1 shows counts for the viable air and floor surface samples. Consistent across five ISO 8 rooms was a significant jump in the contamination rates for viable air in Q3, the hottest months of the year.
“The seasonal variation was there, but I could not see it before when I was trending by excursion only,” Peacos said. “Contamination recovery rates provided a higher level of granularity. They showed us things occurring in the background that we could not see by trending by excursion only.”
The study also showed that excursion rates and contamination recovery rates were not directly proportional. This was crucial as contamination recovery rates fluctuated while excursion rates generally did not.
“This is important,” she explained, “because when you consider that the operators pass through the less clean areas into the cleaner areas, they are going to pick up contaminants and take them along with them. If the overall contamination recovery rates is higher…there is a greater likelihood that manual transmission of contamination into a cleaner area will occur simply because more is present.
“Contamination recovery rates began to supersede the excursion rates in terms of what we used to make general decisions regarding routine controls, such as when we sanitized, or whether we had to do any extra monitoring,” she said, further adding that she did not wholly abandon excursion rates as this data also provided critical information.
“They [excursion rates] provided a frame of reference for the acceptable range we wanted to operate in. They also signaled when a process was operating outside of the normal parameters.” Peacos said. “So, the alert and action levels were not changed when the contamination recovery rates were added. Instead, we used the contamination recovery rates to mitigate before we exceeded those limits, and thus increased our level of control.”
There were a number of payoffs resulting from adding contamination rates to environmental monitoring. Because of the ability to proactively mitigate, fewer excursions occurred, so there were fewer investigations to conduct.
“This resulted in substantial savings in time, labor and material costs,” Peacos said.
When investigations were needed, she found that they were of better quality since the contamination recovery rates provided additional information that ensured better root cause analysis. Subsequently, impact assessments were also of higher quality, and CAPAs were more efficient and effective. Trending reports became more useful due to the increased granularity of the data.
“Adding the contamination recovery rates to the traditional facility trending program substantially increased its power,” Peacos said. “The proactive mitigation—and I cannot say it often enough—led to better microbial control and lower risk. We had greater and earlier visibility of changes to the existing state of control.
“This can be applied to any type of environment, sterile or nonsterile or anything in between, as it is just a simple calculation that is incredibly easy to implement,” she concluded.
[Editor’s Note: Watch Peacos explain the use of contamination recovery rates in an “On the Issue” video on the PDA Letter website.]
Reference
- Denoya, C., and Dalmaso, G., “USP <1116> and its Implications for Measuring Microbial Recovery Rates.” PDA Letter 51 (2015): 26–29.


